
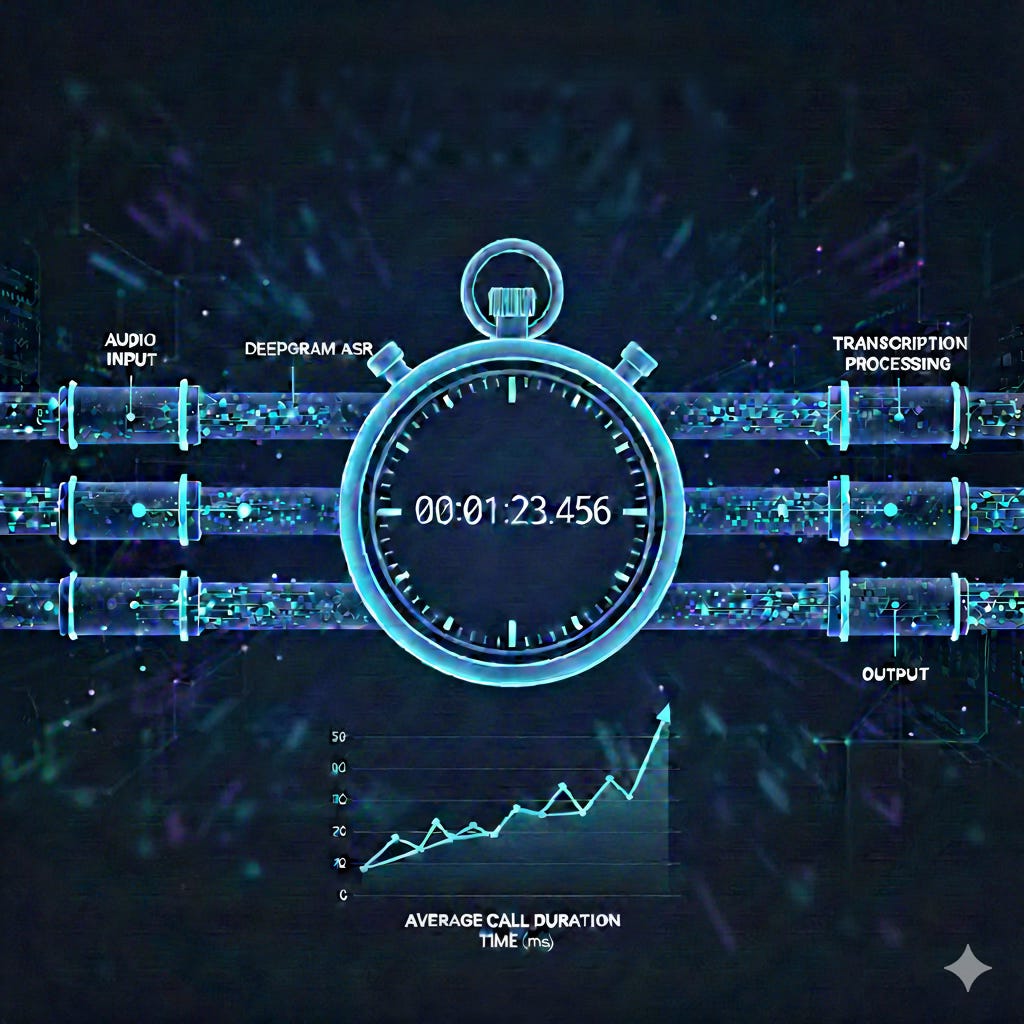
#15 - Where Does the Time Go? Measuring Voice-to-Voice Latency with Pipecat, Modal and Twilio
We recently hit a one-second latency milestone with our inbound call application - but what’s actually happening under the hood during that second?

After building the inbound and outbound voice bots, I kept coming back to the same question: how fast is this thing, really?
I could feel it during calls. You stop talking, there’s a short pause, and then the bot responds. It felt like maybe a second. Not bad - definitely fast enough to have a conversation. But “it feels like about a second” isn’t a measurement. And if I wanted to make it faster, I needed to know where that time was actually going.
Is it the speech recognition? The LLM thinking? The text-to-speech? The network round-trips between all these services? Without numbers, I’d just be guessing.
Turns out, the answer was hiding in plain sight. Pipecat had been tracking this data all along - I just wasn’t listening.
The Data Was Already There
Here’s something that surprised me. In my bot code, I’d had these two flags set from the very beginning:
task = PipelineTask(
    pipeline,
    params=PipelineParams(
        audio_in_sample_rate=8000,
        audio_out_sample_rate=8000,
        enable_metrics=True,
        enable_usage_metrics=True,
    ),
)
See enable_metrics=True and enable_usage_metrics=True? Those tell Pipecat to measure the performance of every service in the pipeline - how long Deepgram takes to return the first transcription, how long Groq takes to start generating tokens, how long the TTS takes to produce audio. Every time audio flows through the pipeline, Pipecat wraps these measurements into something called a MetricsFrame and sends it downstream.
But here’s the thing: nobody was listening. The metrics frames were flowing through the pipeline and getting silently discarded at the end. It’s like having a speedometer in your car that works perfectly - you just never look at it.
What I needed was an observer.
Pipecat’s Observer Pattern
Pipecat has a clean concept for this: observers. An observer is a side-channel listener that sees every frame flowing between processors in the pipeline, but it’s not in the pipeline. It can’t block anything or slow things down. It just watches.
Think of it like a security camera in a factory. The assembly line keeps running exactly the same whether the cameras are on or off. But when they’re on, you can see exactly what’s happening at every step.
Pipecat ships with several built-in observers, and two of them were exactly what I needed:
MetricsLogObserver- Logs every metrics frame to the console: TTFB (time to first byte) for each service, token usage, TTS character counts, Smart Turn decision metricsUserBotLatencyLogObserver- Measures the wall-clock time from when the user stops speaking to when the bot starts speaking, and gives you a summary at the end of the call
Adding them took three lines of code.
Three Lines to Instant Visibility
Here’s the change. I added the observer imports and passed them to the PipelineTask:
from pipecat.observers.loggers.metrics_log_observer import MetricsLogObserver
from pipecat.observers.loggers.user_bot_latency_log_observer import UserBotLatencyLogObserver

# ... existing pipeline setup ...

task = PipelineTask(
    pipeline,
    params=PipelineParams(
        audio_in_sample_rate=8000,
        audio_out_sample_rate=8000,
        enable_metrics=True,
        enable_usage_metrics=True,
    ),
    observers=[
        MetricsLogObserver(),
        UserBotLatencyLogObserver(),
    ],
)
That’s it. No other changes. The pipeline runs exactly the same as before - the observers are purely additive.
Now when I made a test call, the logs lit up with data I’d never seen before:
DEBUG | 📊 [DeepgramSTTService#0] TTFB (nova-3): 0.200s at 14.231s
DEBUG | 📊 [LocalSmartTurnAnalyzerV3#0] SMART TURN: COMPLETE (probability: 95.10%, inference: 11.2ms, server: 14.8ms, e2e: 91.3ms) at 14.322s
DEBUG | 📊 [GroqLLMService#0] TTFB (llama-3.3-70b-versatile): 0.268s at 14.590s
DEBUG | 📊 [GroqLLMService#0] LLM TOKEN USAGE (llama-3.3-70b-versatile): prompt: 290, completion: 17, total: 307 at 14.95s
DEBUG | 📊 [DeepgramTTSService#0] TTFB (aura-2-theia-en): 0.044s at 14.634s
DEBUG | 📊 [DeepgramTTSService#0] TTS USAGE (aura-2-theia-en): 32 characters at 14.95s
DEBUG | ⏱️ LATENCY FROM USER STOPPED SPEAKING TO BOT STARTED SPEAKING: 0.976s
Let me break down what each line means:
STT TTFB: 0.200s - Deepgram took 200 milliseconds to return the first word of the transcription after receiving audio
Smart Turn: 91.3ms e2e - The turn detection model took 91ms to decide (with 95.1% confidence) that I was actually done speaking, not just pausing
LLM TTFB: 0.268s - Groq took 268 milliseconds to start generating the first token of the response
LLM Token Usage: 290 prompt / 17 completion - The context size and response length for this turn
TTS TTFB: 0.044s - Deepgram’s TTS took 44 milliseconds to start producing audio from the first text it received
Total latency: 0.976s - The wall-clock time from when I stopped talking to when I heard the bot start responding
At the end of the call, UserBotLatencyLogObserver printed a summary:
INFO | ⏱️ LATENCY FROM USER STOPPED SPEAKING TO BOT STARTED SPEAKING - Avg: 1.048s, Min: 0.976s, Max: 1.159s
This was already revealing. But I wanted more detail - specifically, I wanted to see the breakdown per turn in a single table, so I could spot patterns across a conversation.
Building a Custom Observer
The built-in observers are great for a quick look, but their log lines aren’t correlated per turn. You can’t easily see “for turn 3, what was the STT latency vs. the LLM latency?” To get that, I built a custom observer called LatencyBreakdownObserver.
Building a custom observer is straightforward. You subclass BaseObserver and implement on_push_frame, which gets called every time a frame passes between two processors in the pipeline:
from pipecat.observers.base_observer import BaseObserver, FramePushed

class LatencyBreakdownObserver(BaseObserver):
    async def on_push_frame(self, data: FramePushed) -> None:
        # data.frame is the frame being passed
        # data.source is the processor sending it
        # data.destination is the processor receiving it
        # data.direction is DOWNSTREAM or UPSTREAM
        ...
The key insight is that certain frame types mark the boundaries of a conversation turn:
VADUserStoppedSpeakingFrame- The user finished talking. Start the clock.MetricsFrame- Contains TTFB measurements from each service. Capture them.BotStartedSpeakingFrame- The bot started talking. Stop the clock.EndFrame/CancelFrame- The call is over. Print the summary.
I created a simple dataclass to hold per-turn data:
@dataclass
class TurnLatency:
    turn_number: int
    stt_ttfb: Optional[float] = None          # seconds
    smart_turn_e2e_ms: Optional[float] = None  # milliseconds
    llm_ttfb: Optional[float] = None           # seconds
    tts_ttfb: Optional[float] = None           # seconds
    total_wall_clock: Optional[float] = None   # seconds
    llm_prompt_tokens: Optional[int] = None
    llm_completion_tokens: Optional[int] = None
    tts_characters: Optional[int] = None
The observer collects one TurnLatency per conversation turn. When it sees a VADUserStoppedSpeakingFrame, it starts a new turn and records the wall-clock time. As MetricsFrame objects arrive, it routes each measurement to the right field by checking the processor name (e.g., "DeepgramSTTService" for STT, "GroqLLMService" for the LLM). When BotStartedSpeakingFrame arrives, it stops the clock and saves the turn.
The full implementation is in observers.py - it’s about 100 lines of focused code.
I added it alongside the built-in observers:
from observers import LatencyBreakdownObserver

task = PipelineTask(
    pipeline,
    params=PipelineParams(
        audio_in_sample_rate=8000,
        audio_out_sample_rate=8000,
        enable_metrics=True,
        enable_usage_metrics=True,
    ),
    observers=[
        MetricsLogObserver(),
        UserBotLatencyLogObserver(),
        LatencyBreakdownObserver(),
    ],
)
The Numbers: Where Does 1 Second Go?
Here’s what the summary table looks like after a real call. This is the payoff - the table prints to the logs when the call ends:
=== LATENCY BREAKDOWN (4 turns) ===
Turn | Total  | STT TTFB | Smart Turn | LLM TTFB | TTS TTFB | LLM Tokens | TTS Chars
-----+--------+----------+------------+----------+----------+------------+----------
   2 | 0.976s |   0.200s |       91ms |   0.268s |   0.044s |     290/17 |       32
   3 | 1.001s |   0.266s |       82ms |   0.268s |   0.029s |     323/33 |      111
   4 | 1.057s |   0.155s |       84ms |   0.268s |   0.013s |     388/84 |      228
   6 | 1.159s |   0.157s |       81ms |   0.271s |   0.006s |     504/33 |       13
-----+--------+----------+------------+----------+----------+------------+----------
 Avg | 1.048s |   0.195s |       84ms |   0.268s |   0.023s |            |
A few things jump out immediately.
The LLM is the slowest component. At 268ms average TTFB, the LLM takes more time than any other service. This is still a 70B parameter model running on Groq, but it’s notably slower than the sub-100ms performance you might expect. This could be due to API queuing, model load, or the specific context size.
The AI services combined take about 570ms. Add up the averages: STT (195ms) + Smart Turn (84ms) + LLM (268ms) + TTS (23ms) = roughly 570ms. That’s the time these services spend doing their thing.
So where’s the other 480ms? The total averages 1.048 seconds, but only ~570ms is accounted for by service TTFB. The rest is pipeline overhead: network round-trips between your server and each external API (Twilio to Modal, Modal to Deepgram, Modal to Groq, Modal to Deepgram again), audio buffering, frame serialisation, and the VAD’s own silence detection window before VADUserStoppedSpeakingFrame even fires.
Turn 4 generated the longest response. With 84 completion tokens and 228 TTS characters, it had the most content to generate. Interestingly, the LLM TTFB stayed constant at 268ms regardless of response length - time to first token doesn’t depend on how many tokens will eventually be generated.
Context grows, but TTFB stays remarkably flat. Notice how the prompt token count grows from 290 to 504 across the conversation (each turn adds to the context), but LLM TTFB barely changes (268ms to 271ms). Despite doubling the context size, inference latency remains essentially constant.
What Would Actually Make It Faster?
Now that we have numbers, we can think about optimisation rationally instead of guessing.
The LLM is the biggest opportunity. At 268ms average TTFB, the LLM accounts for over 25% of the total latency. This could potentially be improved by using a smaller/faster model, ensuring optimal Groq API configuration, or exploring self-hosted LLM inference with a model optimized for low latency. The question is whether faster inference would compromise response quality.
Network round-trips and pipeline overhead matter. About 480ms (nearly half the total latency) is spent on overhead: network round-trips between your server and each external API (Twilio to Modal, Modal to Deepgram, Modal to Groq, Modal to Deepgram again), audio buffering, frame serialisation, and the VAD’s own silence detection window before VADUserStoppedSpeakingFrame even fires. Self-hosting these services on the same infrastructure could eliminate many of these round-trips. The location of each component, for example the region where these components are deployed to will also have a bearing on the latency.
Smart Turn is surprisingly fast. At just 84ms average, the turn detection is much faster than expected and not a bottleneck. The VAD’s stop_secs parameter (likely set to around 0.3-0.5s) adds some additional latency, but further reduction would risk more false positives.
STT and TTS are well-optimized. Deepgram STT at 195ms and TTS at 23ms are both performing well. There’s not much to gain here without sacrificing quality.
Try It Yourself
All the code for this - the observers, the bot changes, everything - is in the latency/ directory of the GitHub repo.
It’s a self-contained version of the inbound bot with the observers wired up. Deploy it with:
cd twilio-chatbot/latency
cp env.example .env
# Fill in your API keys in .env
modal serve modal_app.py
Make a call, and you’ll see the metrics flowing in your logs. The observers work identically with the outbound bot too - just add the same three imports and the observers parameter to the PipelineTask.
What I find most interesting about these numbers is what they suggest about the next step. The API services are fast, but the network overhead is significant. What if you could run your own STT, LLM, and TTS on the same GPU, eliminating the network hops entirely? Pipecat already supports self-hosted alternatives like Faster-Whisper for STT, vLLM or Ollama for the LLM, and XTTS for TTS. The question is: would self-hosting actually be faster - and at what cost?
That’s exactly what I’m going to find out next.